Code Sprint 2014: Debugger
While I was unable to actually attend Begeistert this time around, I was nonetheless able to take some time off work to join in on the traditional during/post-BG code sprint. As per usual, this revolved around improving our integrated debugger.
Expressions
The first thing I chose to work on this time around was adding support for expression evaluation. Many times when debugging, it can be handy to be able to do some quick math/bit operations, i.e. to calculate an offset when trying to figure out what was being accessing during a crash. Up until now however, we’ve lacked the ability to do this. Not any more: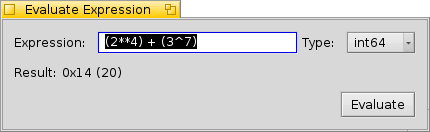
The expression evaluator we now have supports all the basic math, bit and logic operations, using a more or less C-style syntax, with the exception of also supporting powers via the operator ‘**’. I should note that it was initially based on the work done for parsing expressions for DeskCalc, so kudos to everyone who worked on that for making my life a bit easier to start with. It has however, been heavily modified in the meantime, as the needs here are quite different from those in a calculator. For one, arbitrary precision isn’t quite as desirable here, especially if one wants to model the behavior of actual code, and as such it works using more traditional data types. For another, it now handles various operations that one would more typically see in code, but not so much in general purpose math.
A significantly more interesting capability that it now supports, however, is to use the values of active variables in said expressions, as seen below: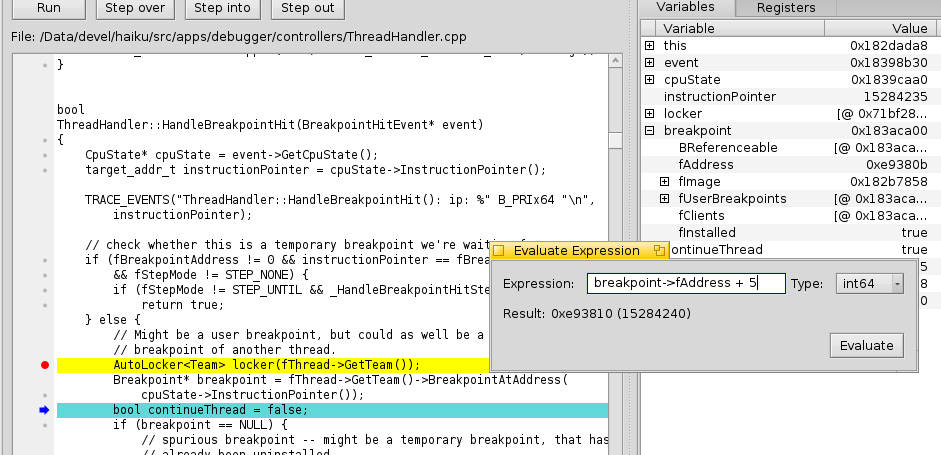
There are still a few missing pieces of syntax that would be nice to eventually support, such as array subscripts and unary pointer deferencing, and those will be added as time permits. In any case, the evaluator can now be accessed via the Tools menu. It should also be noted that expressions can be used to calculate the address one wishes to look at in the memory inspector, as well as the target address of a watchpoint.
Conditional Breakpoints
While expressions are helpful in various cases in and of themselves, I had an ulterior motive in implementing them, and that’s because they are essentially a prerequisite for properly supporting conditional breakpoints. What these allow one to accomplish is setting up a breakpoint that only triggers when certain criteria have been met. For instance, suppose one has some code running in a loop for several hundred iterations, but the problem that’s being analyzed only occurs deep within that loop. Traditionally, one would have to set the breakpoint, and then keep manually continuing until you’ve reached that goal, which, in the less trivial cases, is pretty much a recipe for RSI, and might also be considered roughly as entertaining as watching paint dry. Enter conditional breakpoints.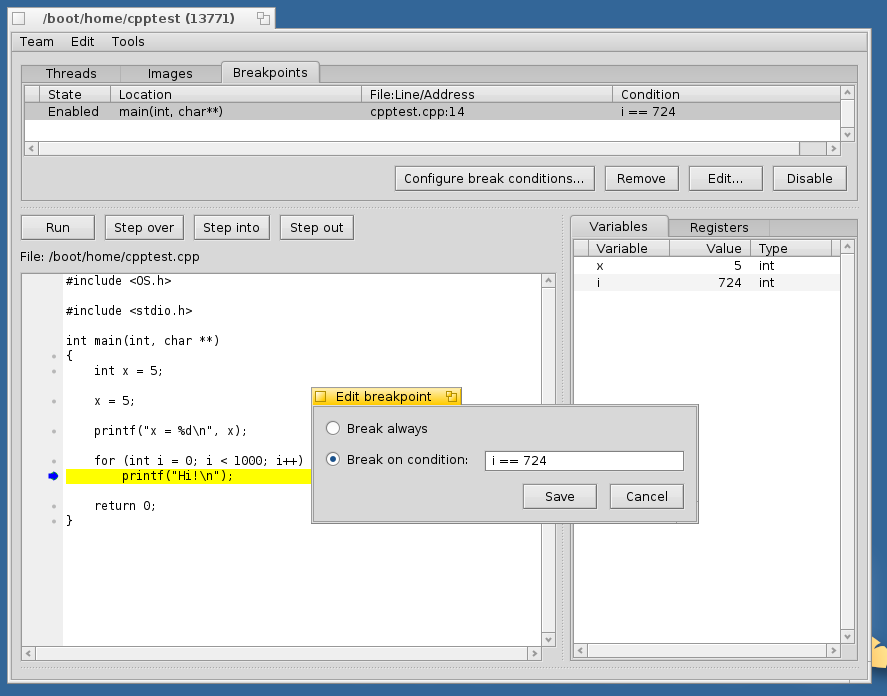
Now, one can set that breakpoint as usual, but also associate a condition with it. That condition takes the form of (wait for it) an expression. In the example above, we have a very simple test program that runs a for loop for several hundred iterations. We want to stop in the middle of that. So, we set our breakpoint, and with it, the expression “i == 724”. What then occurs as our program runs is, each time the breakpoint is hit, the debugger attempts to evaluate the attached expression. If that expression evaluates to zero, the breakpoint is ignored and execution continues. Only in the case where the expression evaluates to a non-zero value will the program actually be stopped at that breakpoint (or if something goes wrong during evaluation such that we can’t actually determine the result of the expression correctly). In many cases, this can make tricky problems much simpler to analyze. This functionality can be accessed in one of two ways: either via the breakpoint management tab, or by simply right clicking on the corresponding breakpoint marker.
Miscellaneous
As it’s been quite a while since I last posted a blog update, various other things have been worked on, though most of them weren’t really worthy of their own post. For the most part, these consisted of under the hood improvements that aren’t necessarily as directly user visible, such as bug fixes and various improvements to our x86-64 support and the output of our automatic crash reports. A few things however, are potentially of interest to Debugger users:
- Improvements have been made to the memory inspector, such that one can now select and copy a range of data to the clipboard, and use keyboard shortcuts to navigate between blocks.
- If one has to help the debugger locate source files, the path mappings are now saved in settings, so they're remembered the next time the same program is loaded. Also, when asking to locate a source file, we now initiate a BFS query for the filename in question, and show any potential candidates in a drop down menu, in addition to the option to explicitly locate the file yourself.
- It is possible for a program to be built for debugging, but to have the actual debugging information data located in an external file. We now detect a program that has been built as such, and, if the external file can't be found, ask the user to locate it. Furthermore, if it's detected that the program in question came from a package, we also attempt to look up a corresponding debug information package, and if one is found, prompt the user to automatically install it.
- In the variables view, an additional item is now available in the context menu that allows one to copy the selected variable's value to the clipboard.
- In the registers view, one can now right click on a register and choose Inspect. This interprets that register's stored value as a memory address, and tries to jump to it accordingly.
- The variables view now highlights the values of variables that have changed since the last step.
Going forward
As always, there remains quite a laundry list of things to add support for, as well as various smaller feature requests that have accumulated over time. Since my free time is generally a bit more limited lately, I will most likely be tackling some of the smaller ones in the near future, as well as the usual stream of bugs to fix (thanks to everyone for reporting!). Until next time!