Retrofitting for kernel debugging
Unlike BeOS, our kernel includes some pieces of C++ code, which sometimes give a headache when it comes making sense of a stack crawl from the kernel debugger, since symbols are mangled when linked into binaries, which means we must Decode__12CrypticCNamesPCc. I recalled seeing some gcc4 private API to demangle symbols into human-friendly names, but the code doing that, from libsupc++, has been written without concern for the inhabitants of the Kernel Debugging Land, using calls to malloc, realloc and free... But I still wanted to get nicer names, so I didn't give up. I also wanted to be able to get assembler dumps since not everyone has a serial cable to make use of the gdb stub.
CrypticNames::Decode(char const *)
Starting from gcc3, libsupc++, which is part of the gcc runtime, includes an API to demangle symbols.
It is documented, and is located into an object named cp-demangle.o inside libsupc++.a. However, it makes use of malloc() and related calls to extend the supplied buffer in case it's too short.
A solution to this is to fool the object in question into calling our own version of malloc() that will fail by returning NULL instead of trying to grab a lock from inside the kernel debugger.
To achieve this, we declare malloc(), realloc() and free() calls inside the code of our module, with C linkage, and implement them as no-ops. Then we must link cp-demangle.o directly to our own object, because just linking with libsupc++ will either use the exported malloc from the kernel or fail by requesting other userland libraries.
Then we just call cxa_demangle() from the hook we install when the module loads, and return the buffer on success, or the passed string otherwise. Of course one can only use the buffer once at a time, so trying to kprintf() two demangled symbols at once wouldn't work, but it's just fine for printing a stack crawl where we only show one symbol per line.
I've still to figure how to extract cp-demangle.o from libsupc++ from the Jamfile at build, but otherwise, everything works perfectly. Of course this only works with gcc4.
Until it's fixed, one must do the following once to be able to build it:
ar x generated/cross-tools/i586-pc-haiku/lib/libsupc++.a cp-demangle.o
mkdir -p generated/objects/haiku/x86/release/add-ons/kernel/debugger/demangle
cp cp-demangle.o generated/objects/haiku/x86/release/add-ons/kernel/debugger/demangle/
Then you can just add
The code is of course in svn, there.
mov yourBody,%eax
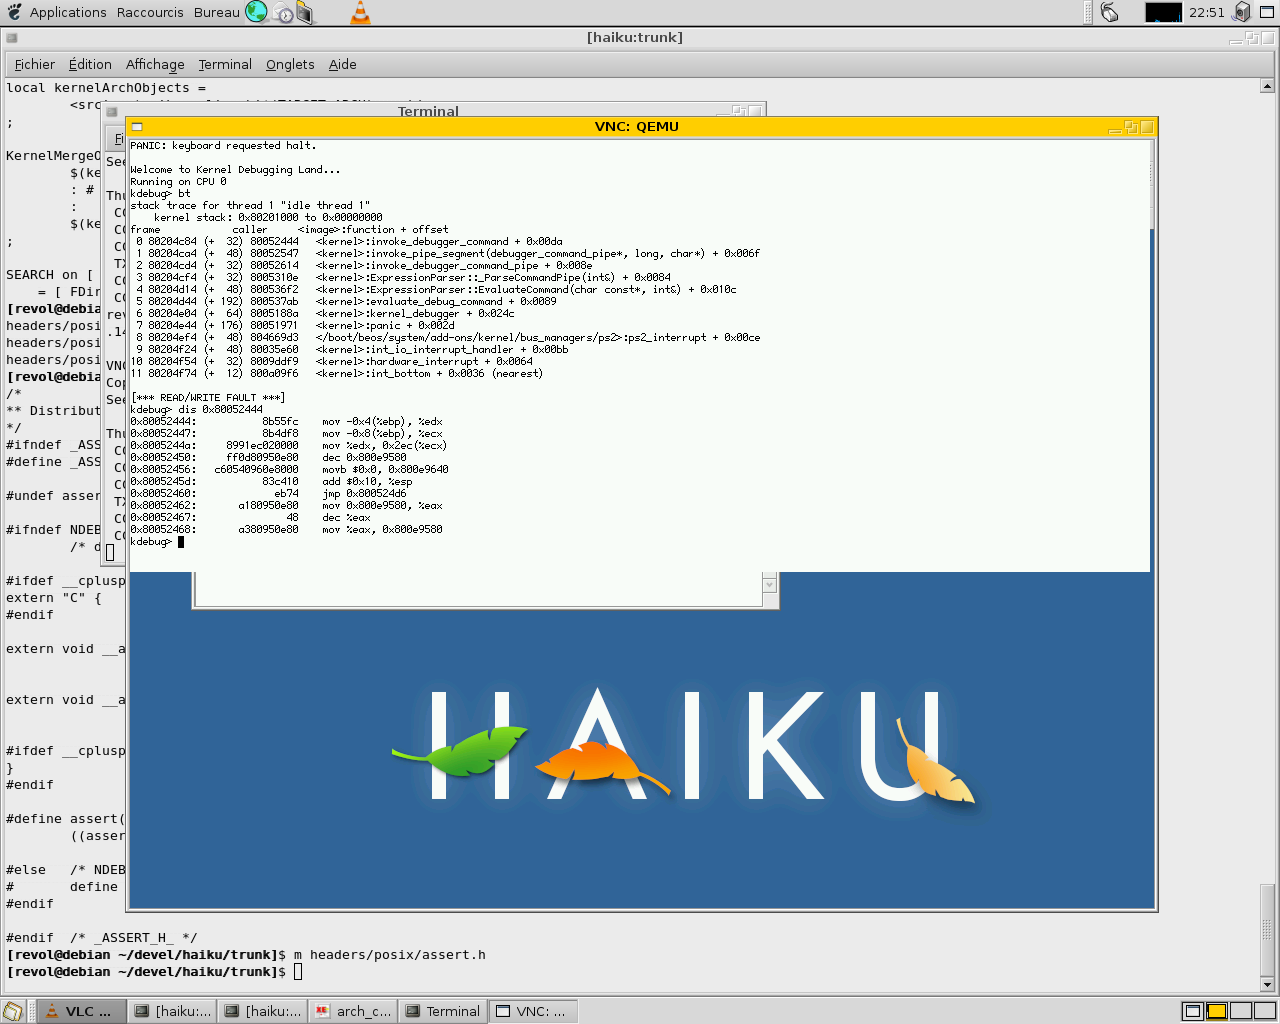
BeOS R5 allowed to disassemble code from inside the kernel debugger, to help understand what was wrong on a crash. Of course, one can always note the virtual address of the offending eip, objdump --disassemble the module (or use reveng of course), and search the megabytes of generated asm for the address to find the code. But that requires doing it on either another machine, or the same machine after rebooting, and so loosing the context of the crash.
There are several disassembler projects around, but many were under GPL, and the other few I tested, like bastard, used realloc or other things we don't have access to from KDL, or were just too bloated for a small module.
Luckily there was one left that met the criteria, Udis86. It's BSD licensed, small, and doesn't use dynamic allocation but a single struct containing the required context, that we can allocate statically inside the module. It even supports both AT&T and intel syntax, 16, 32 and even 64 bit code for later. The API is very straightforward to use also, and well documented.
The only issue was that Udis86 calls assert() in some places, and uses stdio when used with a FILE* stream. Instead of changing the code, we just have a disasm_arch_assert() function, and define assert to it to have it called. We also define __UD_STANDALONE__ to tell it not to use stdio calls in the Jamfile.
The module itself then is just a wrapper that provides a KDL dis <addr> [count] command and loops on Udis86 to get each line until the count is reached.
It is organized with an architecture specific folder, with the udis86 lib in x86/, so other disassemblers can be used for other cpus.
It should of course be spiced up to look up addresses to print symbol+offset and so on, but at least it allows to find what the offending operation was instead of just knowing in which function it happened.
Here you can see both in action: